Point Clouds
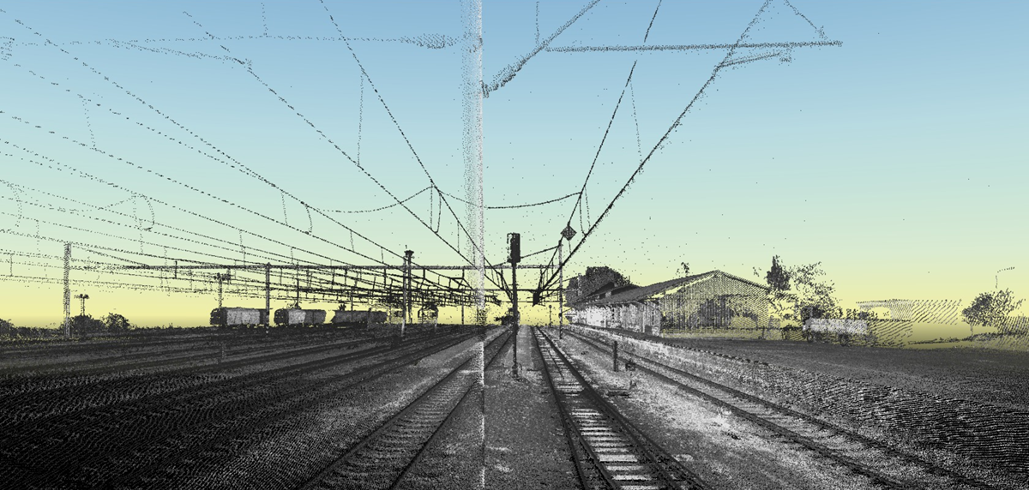
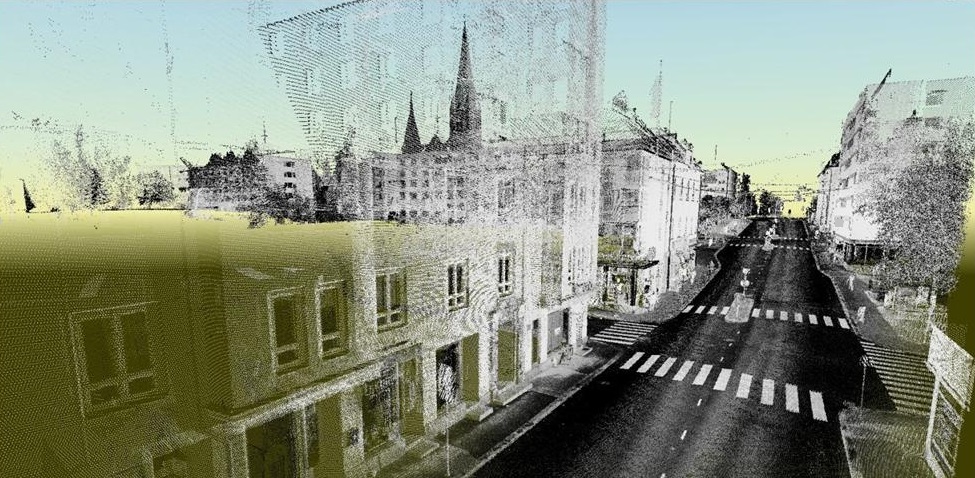
The basic output of laser scanning is a point cloud. There are millions of points and each of them has its exact x, y, z coordinates.
In addition to the coordinates, each point cloud also contains colour information. Either it can be a laser beam reflection value converted to grayscale (x, y, z, intensity) or RGB information obtained from the photo (x, y, z, R, G, B). The point cloud can be saved in various data formats.
Any vector drawing can be evaluated from point clouds using specialized software. The final vector can then be exported for further use in various data formats as required (dxf, dgn, etc.).
A very accurate and detailed 3D model can be generated from the point clouds.
It is possible to create digital model terrain (DMT) of required territory from measured data using digital modelling software. By analysing this model, we can determine data such as declination, area, etc.
Either directly from the point clouds or from DMT, we can generate profiles of any direction and contour lines at different intervals. Slices and contour lines can also be exported as a vector drawing.
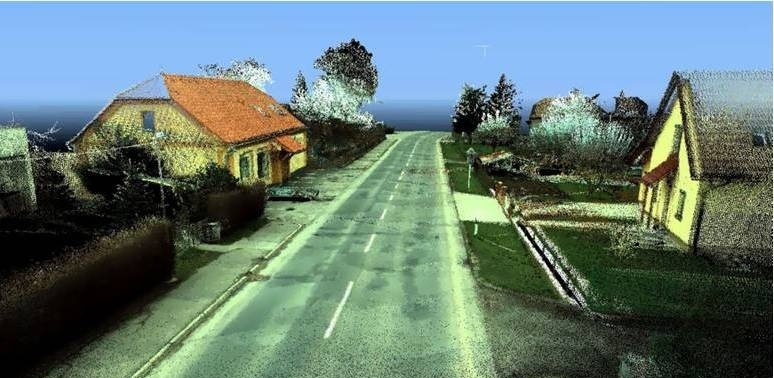
Mobile mapping covers a detailed continuous surveying strip of up to 200 m wide with an average point density of 400-500 m2. Each point has its exact spatial coordinates X, Y, Z.

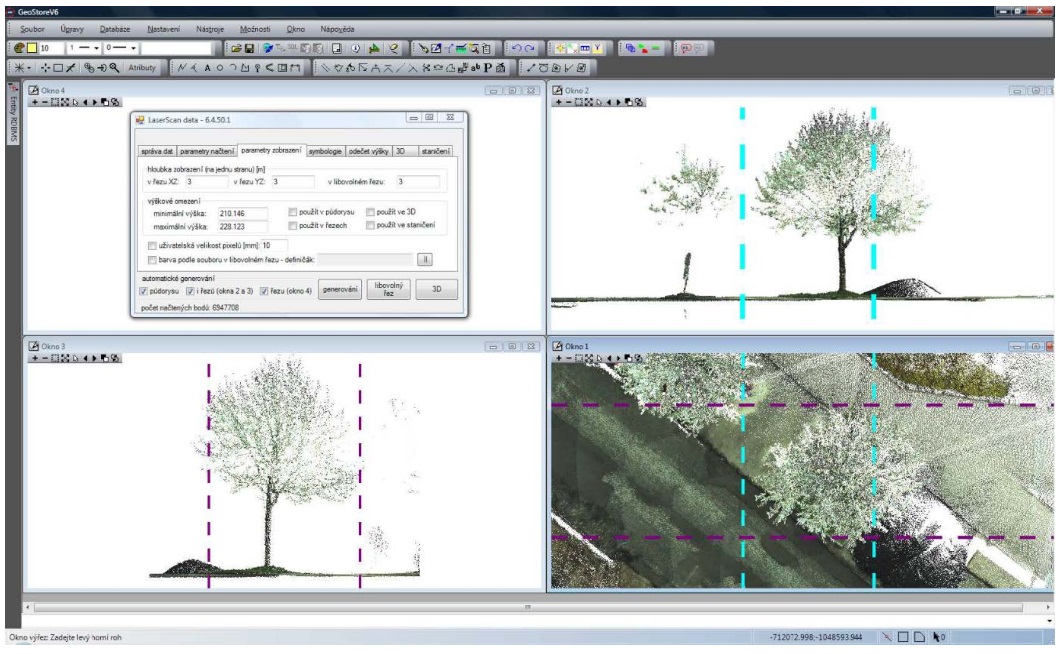
SW GeoStore V6 - sample evaluation from point clouds.